
Live Satellite View of Hawaiʻi, Explained

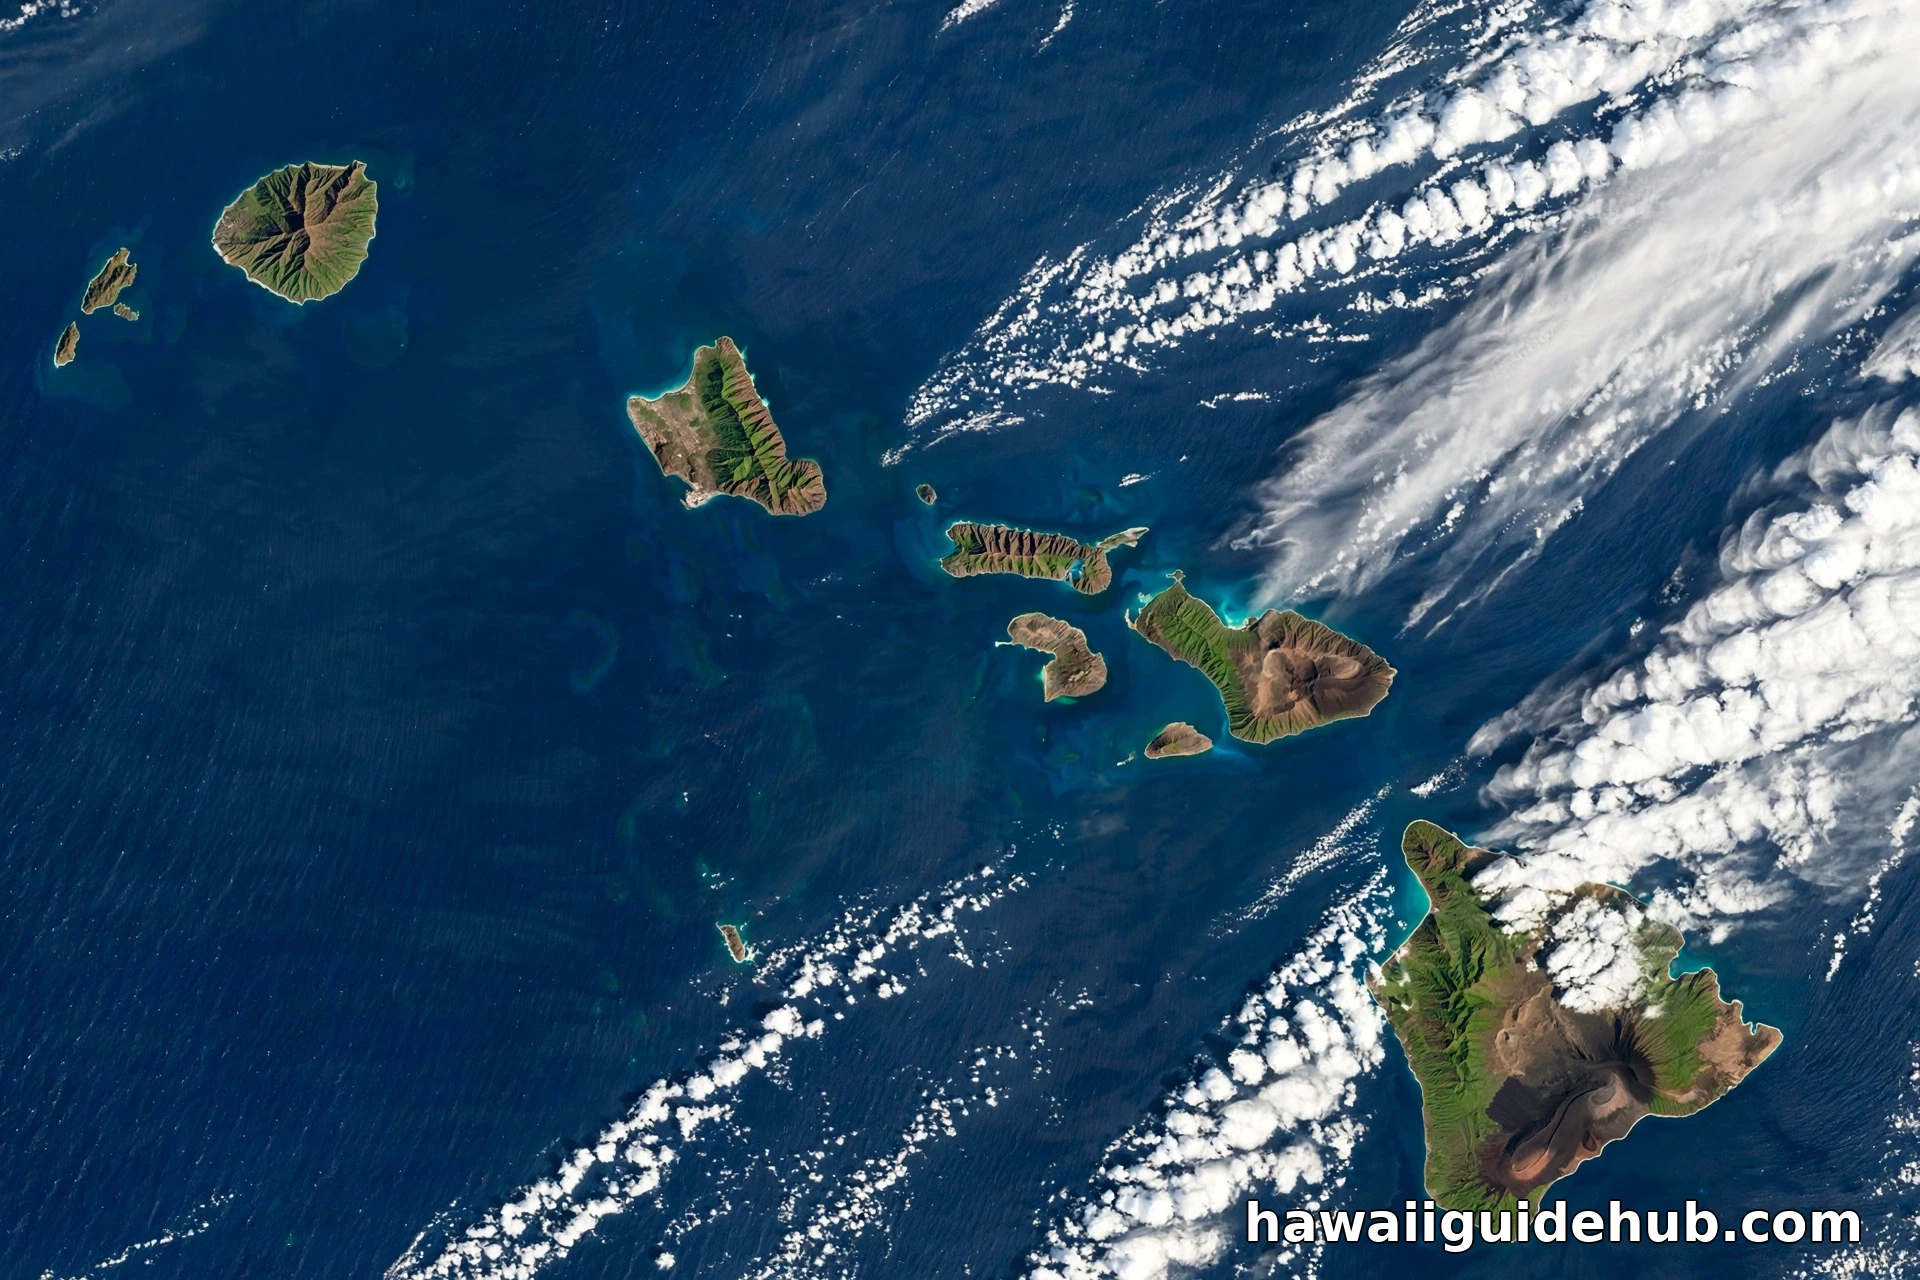
There is a camera watching Hawaiʻi right now, and it never blinks. Parked in geostationary orbit about 22,236 miles above the Pacific, NOAA’s GOES-West satellite scans the Hawaiian Islands every few minutes, day and night, in visible light, infrared, and water vapor. Its Hawaii sector imagery is free for anyone to watch live, and once you know how to read it, it becomes one of the most useful planning tools a Hawaiʻi traveler can carry: you can see the trade wind showers building on the windward slopes, a Kona low swinging moisture over the leeward coasts, the vog plume trailing from Kīlauea, and a hurricane organizing itself a thousand miles away. This guide explains where the live satellite view of Hawaiʻi actually comes from, where to watch it, what the different views mean, and how to use them on a real trip.
The Short Answer: GOES-West Watches Hawaiʻi
The satellite behind nearly every live Hawaii weather image is GOES-18, which operates as GOES-West. NOAA records show it launched on March 1, 2022, took its station at 137 degrees west longitude, and entered operational service as GOES-West on January 4, 2023, replacing GOES-17. From that fixed point above the equator, its main camera, the Advanced Baseline Imager, photographs the full Pacific disk and zooms into sectors. The Hawaii sector is one of those standard views, and NOAA’s NESDIS STAR site publishes it as animated loops that refresh with new images about every ten minutes. When a website or app shows you a live satellite view of Hawaiʻi, this is almost always the feed behind it, sometimes repackaged, never truly instantaneous: live, in satellite language, means a fresh picture every few minutes, delivered minutes after it was taken.
| The satellite | GOES-18, operating as NOAA’s GOES-West |
| Its station | Geostationary orbit at 137 degrees west, about 22,236 miles up |
| Operational since | January 4, 2023, as GOES-West |
| Hawaii sector updates | New images about every 10 minutes on NOAA’s viewer |
| Best all purpose view | GeoColor: true color by day, infrared by night |
| Best night view | Infrared bands, which work in total darkness |
| High detail snapshots | NASA Worldview, from polar orbiting satellites, updated daily |
| Hurricane season context | Central Pacific season runs June 1 to November 30 |
Where to Watch the Live View
NOAA’s GOES image viewer
The primary source is NOAA itself. The NESDIS STAR GOES viewer offers a dedicated Hawaii sector with a menu of bands and products, plus animated loops ranging from a couple of hours to well over a day. Start with GeoColor and a two hour loop. GeoColor, developed with the Cooperative Institute for Research in the Atmosphere, blends true color imagery by day with a multispectral infrared view at night, so the loop reads naturally around the clock: blue ocean, green and brown islands, and white clouds by day; a tinted infrared picture after dark in which low liquid clouds show blue gray and high ice clouds show bright white. One caution NOAA itself attaches: the city lights in nighttime GeoColor come from a static database, not from live cameras, so they show where lights usually are, not what is lit at that moment.
The National Weather Service in Honolulu
The National Weather Service forecast office in Honolulu republishes GOES imagery for its forecast area, which is the practical version for trip planning: the same satellite pictures, framed around the islands and sitting one click away from the marine forecasts, surf discussion, and any active weather statements. During hurricane season, the Central Pacific Hurricane Center in Honolulu is the authority for tropical systems, and its satellite pages are where a live view turns into official guidance. If the satellite shows you something spiraling, the hurricane center is where you check what it means.
NASA Worldview and the aggregator apps
For detail instead of speed, NASA Worldview stitches together imagery from polar orbiting satellites such as Terra and Aqua. These pass over Hawaiʻi a few times a day rather than staring continuously, so the view is not live, but the resolution is far finer: snow on Mauna Kea, sediment plumes after heavy rain, and individual cloud shadows all show clearly. Popular weather apps and sites such as Zoom Earth sit in between, republishing the GOES feed every ten minutes over an interactive map with rain, wind, and pressure layers. They are excellent for a quick look. Just remember the data is NOAA’s, and NOAA’s own viewer is the version with nothing added.
How to Read What You Are Seeing
A normal Hawaiʻi day from orbit has a signature you will learn in one viewing. Trade winds push rows of small white cumulus clouds from the northeast, and the islands comb them: clouds pile up and thicken over the windward mountains, stream through the channels between islands, and thin out over the leeward coasts, which often sit in clear slots of blue. On the Big Island you can regularly see the cleanest example in the state, cloud stacked over the Hilo side while the Kona coast basks in a clear slot, exactly the pattern our Hawaii weather in June guide describes from ground level. Watch the loop in motion, not the still. Satellite literacy is mostly motion literacy: clouds that grow and tower are building showers; clouds that stream sideways and thin are dying.

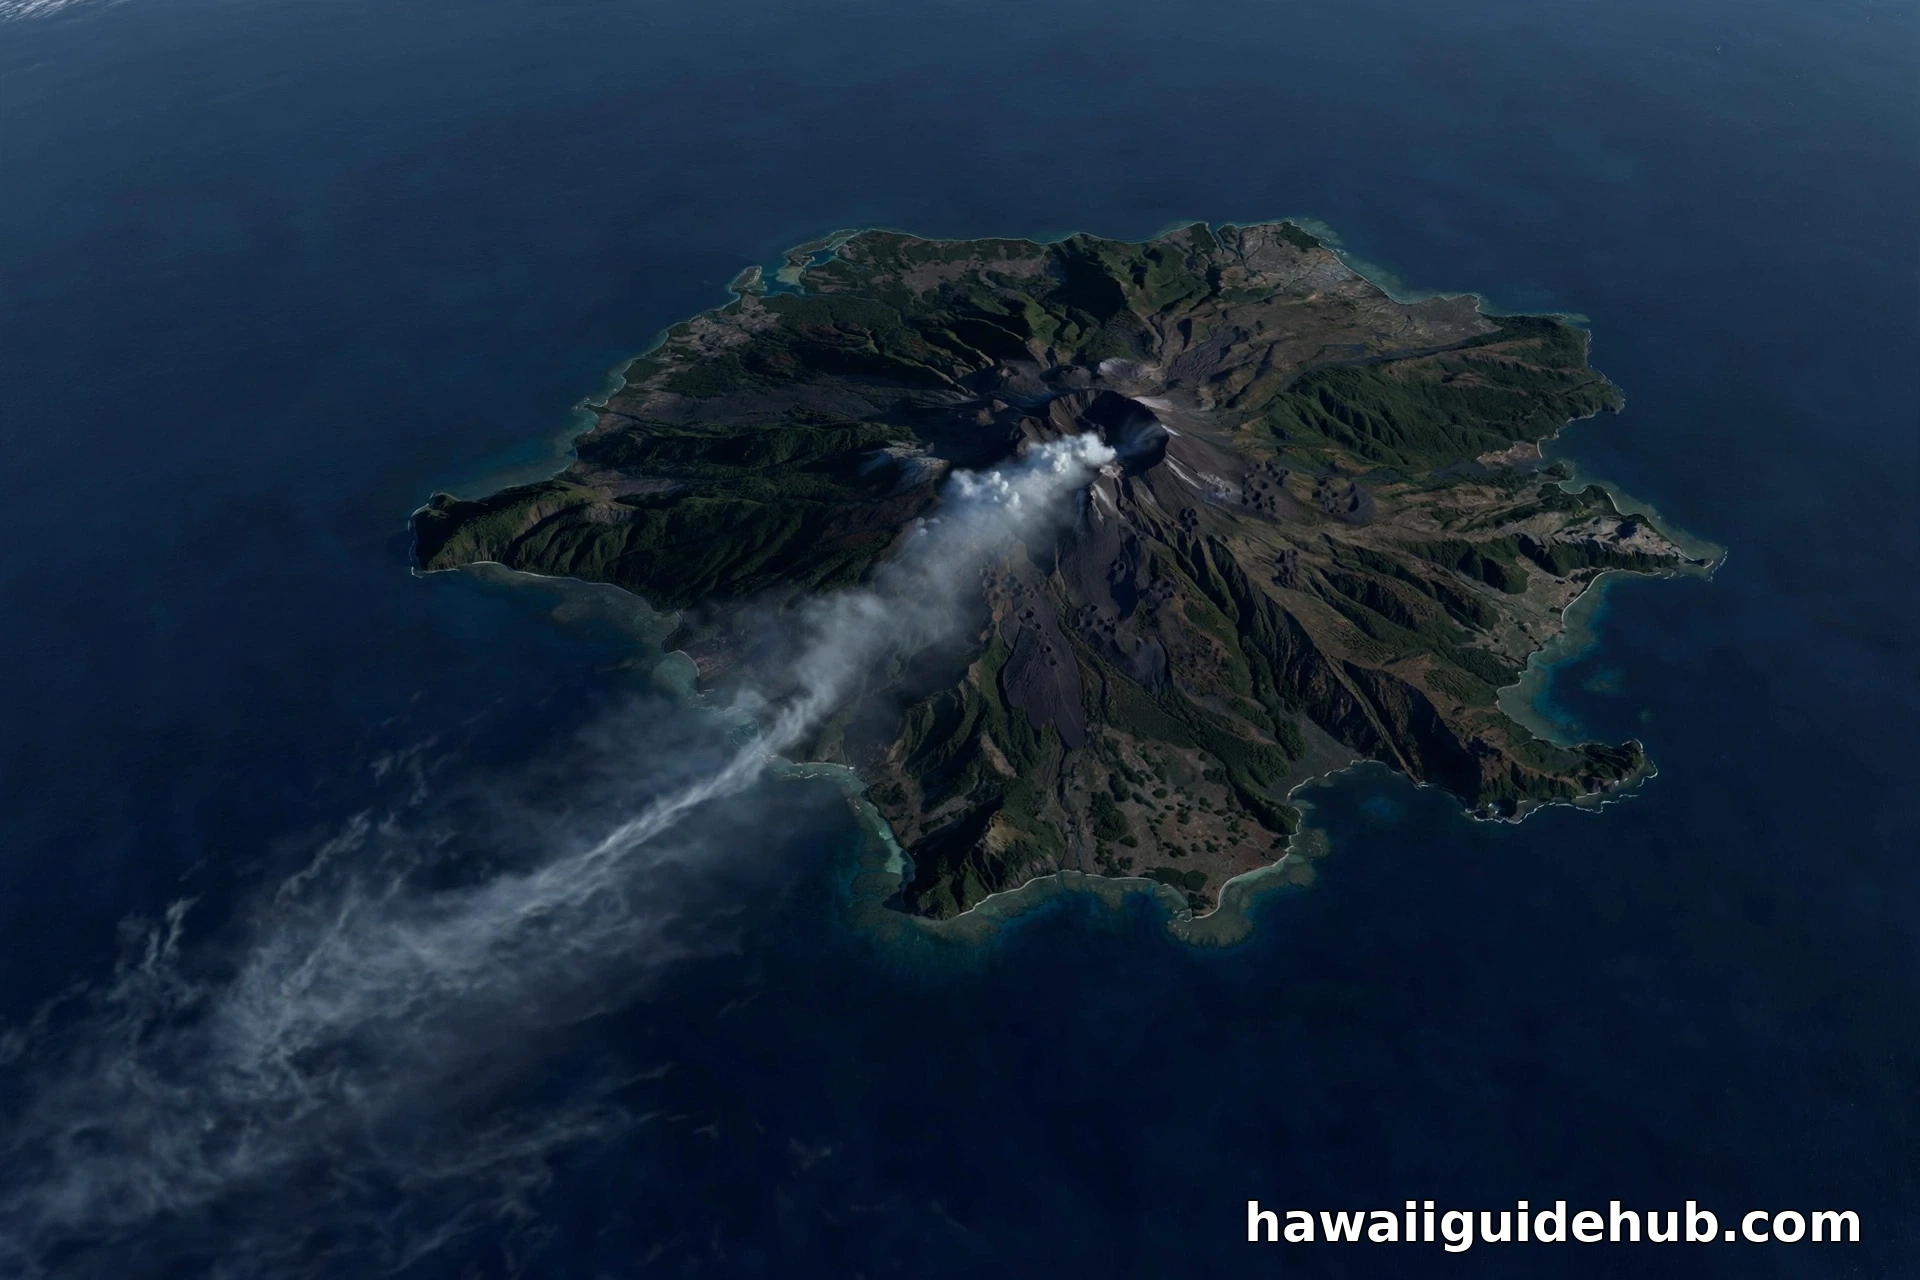
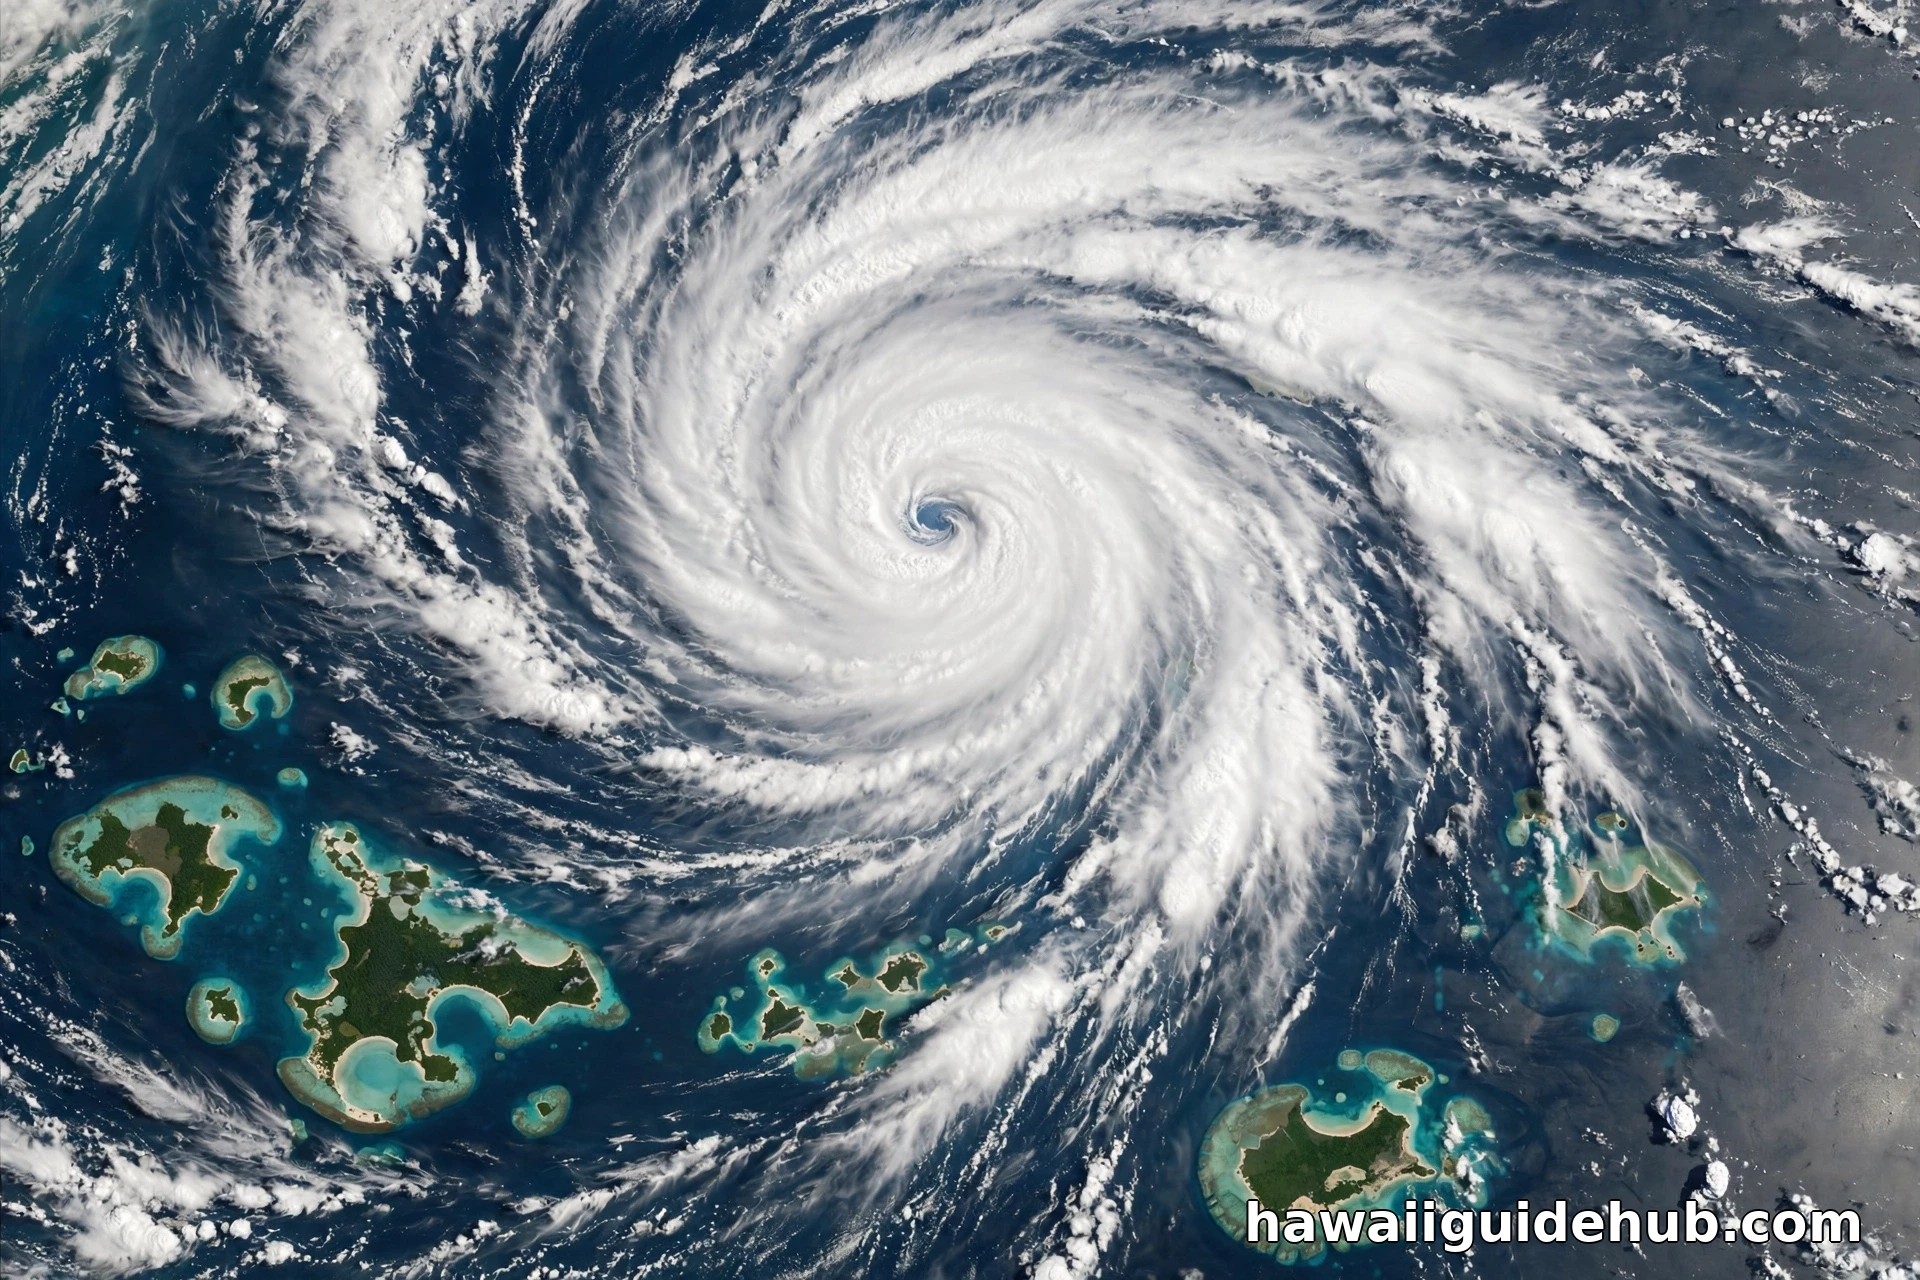
Three special patterns are worth knowing. A Kona low appears as a broad swirl west or northwest of the islands, dragging bands of cloud over the state from the south; when you see it, expect the leeward sides to get the rain for once, as our Hawaii weather in July and seasonal guides rarely get to show you. A tropical cyclone is unmistakable: a tight spiral, sometimes with a clear eye, and during the June through November season it deserves immediate respect and a visit to the hurricane center page. And the vog plume shows as a pale, milky streamer trailing southwest from the Big Island when Kīlauea is active and the trades are blowing, a visible explanation for hazy days on the Kona coast and sometimes islands beyond.
Using the Satellite View to Plan Real Days
The practical routine takes two minutes each morning. Open the Hawaii sector GeoColor loop and ask three questions. Where are the clouds stacked this morning, windward as usual or somewhere strange? Which way are they moving, and how fast? Is anything organized approaching from the east or south? If the windward slopes are socked in and the leeward slot is clear, that is a standard trade wind day: beach on the lee side, hike early, expect brief windward showers if you cross the island. If cloud is pouring over the ridges from the south, the pattern is flipped, and plans built on leeward sunshine need a rethink. Our August in Hawaii and Hawaii in September guides show how this daily read changes by season, since late summer brings the warmest ocean, the weakest trades on some days, and the peak of hurricane season vigilance.
Know the limits as well. The satellite sees cloud tops, not rain itself; a white deck can be dry underneath, and a nearly clear sky can hide the vog that dulls a sunset. Visible bands go black at night, which is why the infrared views exist. And no satellite picture replaces the forecast discussion written by Honolulu meteorologists who interpret the same imagery with radar, models, and local knowledge. Use the live view the way pilots and boat captains do: as one honest instrument among several, and the most beautiful one by far.
The Views, Band by Band
NOAA’s viewer can look technical, but four choices cover everything a traveler needs. GeoColor is the default for a reason: it looks like the view from the spacecraft, and its day night blend means the loop never goes useless at sunset. The visible bands, numbered 1 and 2 on the viewer, are the sharpest pictures in daylight and the best for watching small trade wind clouds comb over the ridges; they are also the ones that go black at night. The clean infrared window, Band 13, is the workhorse after dark and the forecaster’s favorite, because it reads cloud top temperature: the coldest, highest, most storm worthy clouds light up clearly against the warm ocean. The water vapor bands strip away the surface entirely and show moisture in the middle and upper atmosphere as flowing rivers and swirls. They are the least intuitive view and the most revealing one for big pattern changes: a water vapor loop shows a Kona low organizing, or dry air undercutting the trades, hours before the change reaches the beach. Spend one evening clicking between the four over the same loop and the whole menu starts to make sense.
Island Wakes: The Curiosity in the Corner
On clear, steady trade wind days, look downwind of the islands, to the southwest, and you may see one of atmospheric science’s prettiest effects: long, smooth wakes in the cloud deck trailing behind the islands for a hundred miles or more, sometimes braided into swirling patterns called von Kármán vortex streets. The islands are obstacles in a river of air, and the clouds trace the eddies the way water traces rocks in a stream. The Big Island, with the tallest mountains in the Pacific, throws the longest wake; Maui and Oʻahu draw their own smaller signatures. None of this changes your beach day by one degree, and that is exactly why it matters. The satellite view is not only a forecast tool. It is the one vantage point from which Hawaiʻi’s weather becomes visible as a physical thing, shaped by the islands themselves, and it rewards anyone who watches it for pleasure as well as for planning.
Video: GOES-18 Becomes GOES-West
NOAA’s overview of how GOES-18 took over the GOES-West station that watches Hawaiʻi and the Pacific.
Frequently Asked Questions
Is there a truly live satellite view of Hawaii?
Nearly live is the honest term. NOAA’s GOES-West Hawaii sector updates with new images about every ten minutes, which is fast enough to watch weather move in animated loops. No public feed shows Hawaiʻi continuously in real time like a video camera.
Which satellite takes the Hawaii weather pictures?
GOES-18, operating as GOES-West from 137 degrees west longitude since January 4, 2023. Its Advanced Baseline Imager produces the visible, infrared, GeoColor, and water vapor views that NOAA publishes and most apps reuse.
Why is the satellite view black at night?
The visible light bands need sunlight, so they show black overnight. Switch to an infrared band or GeoColor after dark. Infrared senses heat rather than light, so clouds show around the clock, with colder, higher cloud tops appearing brightest.
Can the satellite show hurricanes approaching Hawaii?
Yes. Tropical cyclones are among the most dramatic sights in the Hawaii sector and the wider Pacific views: organized spirals that forecasters track image by image. For official watches and warnings during the June 1 to November 30 season, rely on the Central Pacific Hurricane Center.
What is the difference between GOES imagery and NASA Worldview?
GOES stares at Hawaiʻi continuously from geostationary orbit, trading fine detail for constant updates. NASA Worldview uses polar orbiting satellites that pass a few times daily with much sharper resolution. Use GOES for what is happening now and Worldview for close up snapshots of recent days.
Stand on a Hawaiʻi beach at dawn and the sky is a local fact: one valley rainy, one coast clear, a line of cloud parked on the ridge. The satellite view reveals that all of it is one connected machine, trades, mountains, ocean, and islands interacting in patterns you can learn to read in a single loop. Check it with your morning coffee for a few days of any trip, and Hawaiʻi weather stops being a forecast you are given. It becomes a sky you understand.